
Data-Driven Decision Making & AirMed
Data-driven decision-making is the practice of using facts, metrics, and data to guide strategic business decisions.
From optimizing cultivation processes to enhancing marketing strategies, the ability to analyze and act on data can make the difference between thriving and struggling in this dynamic cannabis space. By leveraging data, cannabis operators can gain actionable insights, reduce costs, improve yields, ensure compliance, and ultimately achieve a competitive edge.
Benefits of Data-driven Decision Making
Cannabis cultivation is a complex process influenced by numerous variables. By using data analytics, producers can monitor these variables in real-time, identify trends, and make adjustments to maximize yield and quality.
Cannabis is a resource-intensive product. Data-driven strategies help identify inefficiencies and optimize resource allocation. This ensures that resources are used as effectively as possible and reduces waste. These measures not only decrease operational expenses but also support sustainability initiatives—an important consideration for environmentally conscious consumers.
Compliance requires meticulous record-keeping and traceability throughout the supply chain. Data-driven systems that leverage information to demonstrate adherence to quality and safety standards enhance credibility with regulators and customers alike. Moreover, predictive analytics can help identify potential risks, enabling proactive measures to mitigate them.
As the cannabis industry matures, innovation is key to staying ahead of competitors. Data-driven insights can empower you to experiment with new cultivation techniques, product formulations, and market strategies. By staying informed and agile, you can seize opportunities and respond effectively to market shifts.
With narrow profit margins and significant operational costs, data-driven decision-making can also support financial sustainability. Data analytics can provide insights into cost drivers, helping you identify areas where they can reduce expenses or increase efficiency. Analyzing labor costs and production timelines might highlight opportunities to streamline operations, while inventory data can ensure that stock levels align with demand, reducing the risk of overproduction or stockouts.
AirMed & Your Data
AirMed has always gone beyond other systems by tracking and reporting thousands of fields of data.
Dozens of reports come standard with AirMed, but we also offer an optional report designer to create unlimited custom reports with access to every field of data in the system. You can select individual fields to include in a report and add options to manage master-detail relationships, cross-tab reports, table and vertical reports, and filter options.
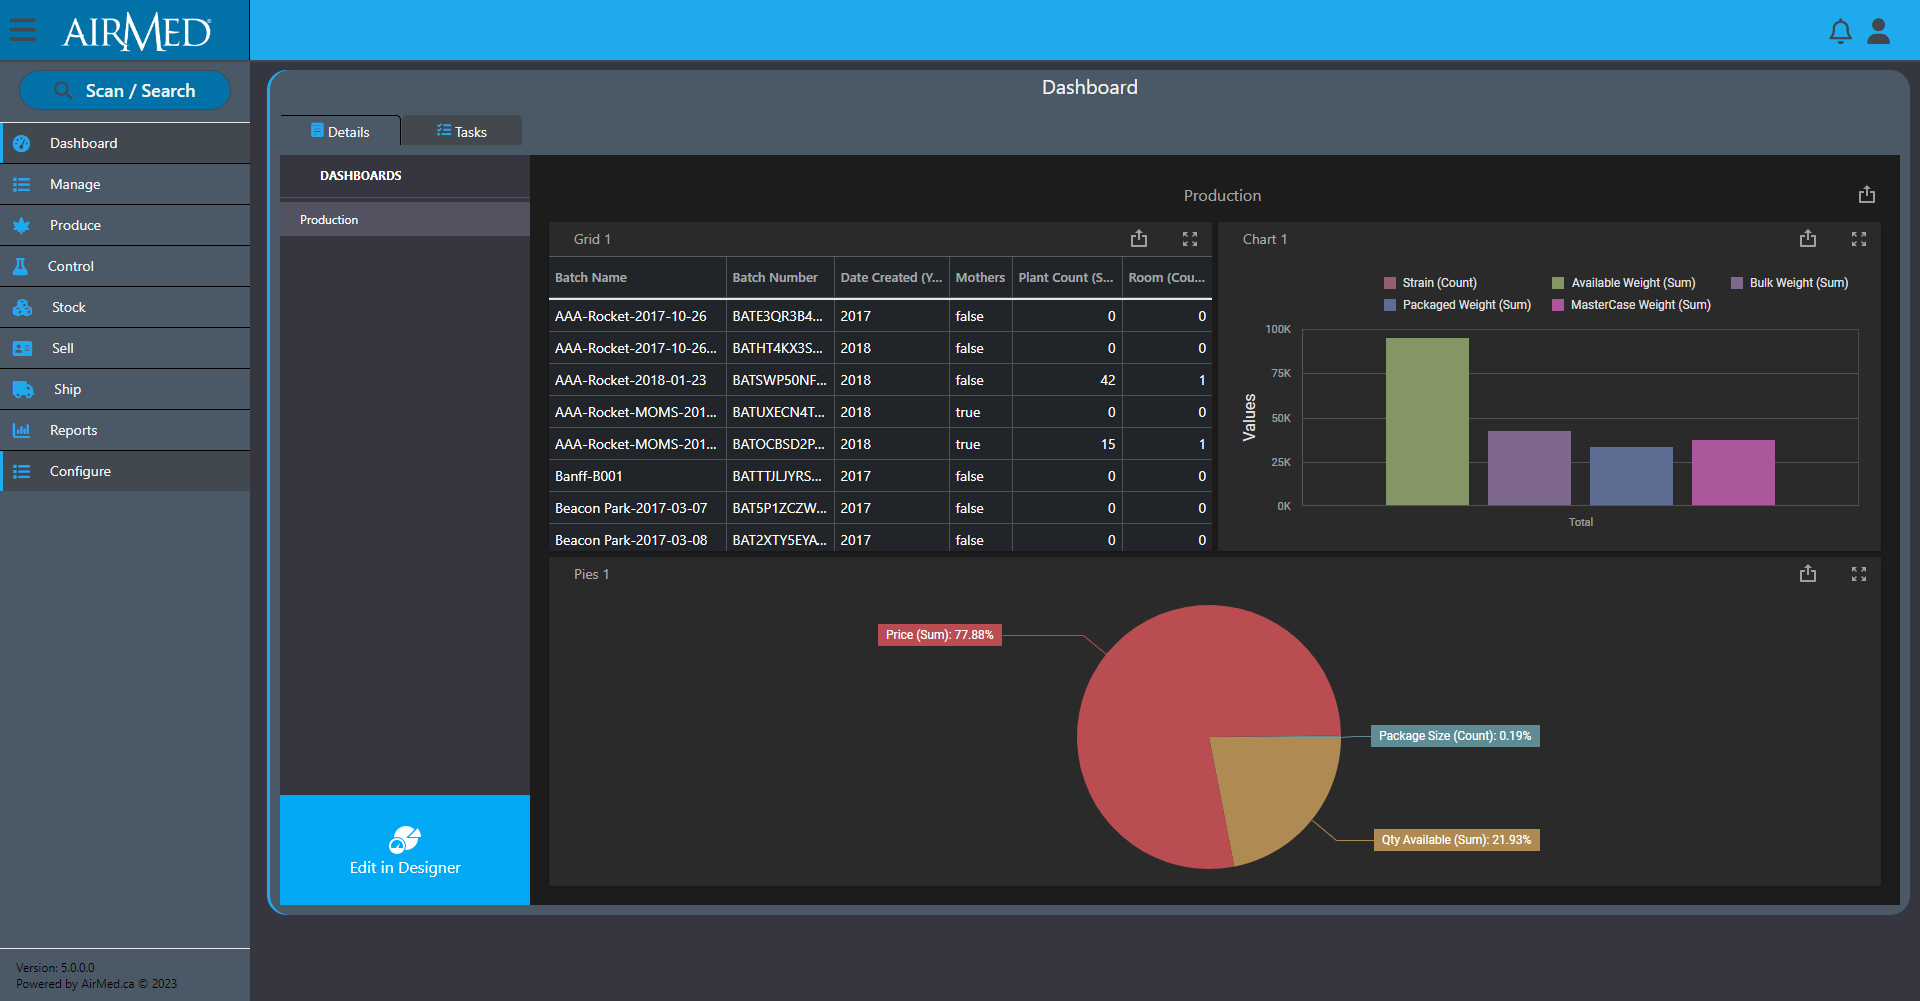
And our optional business intelligence (BI) designer provides pre-designed dashboard widgets that offer the best data visualization option for you. You can create insightful and information-rich decision support systems by simply selecting the appropriate UI widget: Chart, Pivot Table, Data Card, Gauge, TreeMap, Map, Grid, or simple Filter elements. By dropping data fields, results are immediate, accurate and always relevant.
For those who wish to edit or create new widgets, the BI Dashboard is engineered to let you spend more time on business and less on UI customization. Whether it’s manipulation of individual chart series, specifying a pivot table’s dimensions or connecting UI elements to fields across different data-sources or data providers, the BI Dashboard designer is built to make your experience a productive one.
Conclusion
Incorporating data-driven decision-making provides the ability to collect, analyze, and act on data to optimize processes, improve product quality, reduce costs, ensure compliance, and remain competitive. AirMed has been designed to help you embrace a data-driven approach.
For more information visit our Software page.